Are your students up for a data-driven challenge? Of course they are! In our March blog post, we're featuring three activities your students can do to practice identifying the mean, median, mode, and range of a data set. Read on to find out more!
The following activities are fun and easy ways to help your elementary students determine the mean, median, mode, and range of a data set. Choose an activity for the whole class, opt for one that children can practice on their own—or give all three games a go! These activities are ideal for students in fourth grade, fifth grade, and sixth grade.
Be sure to tag I Know It on social media so we can check out your data adventures!

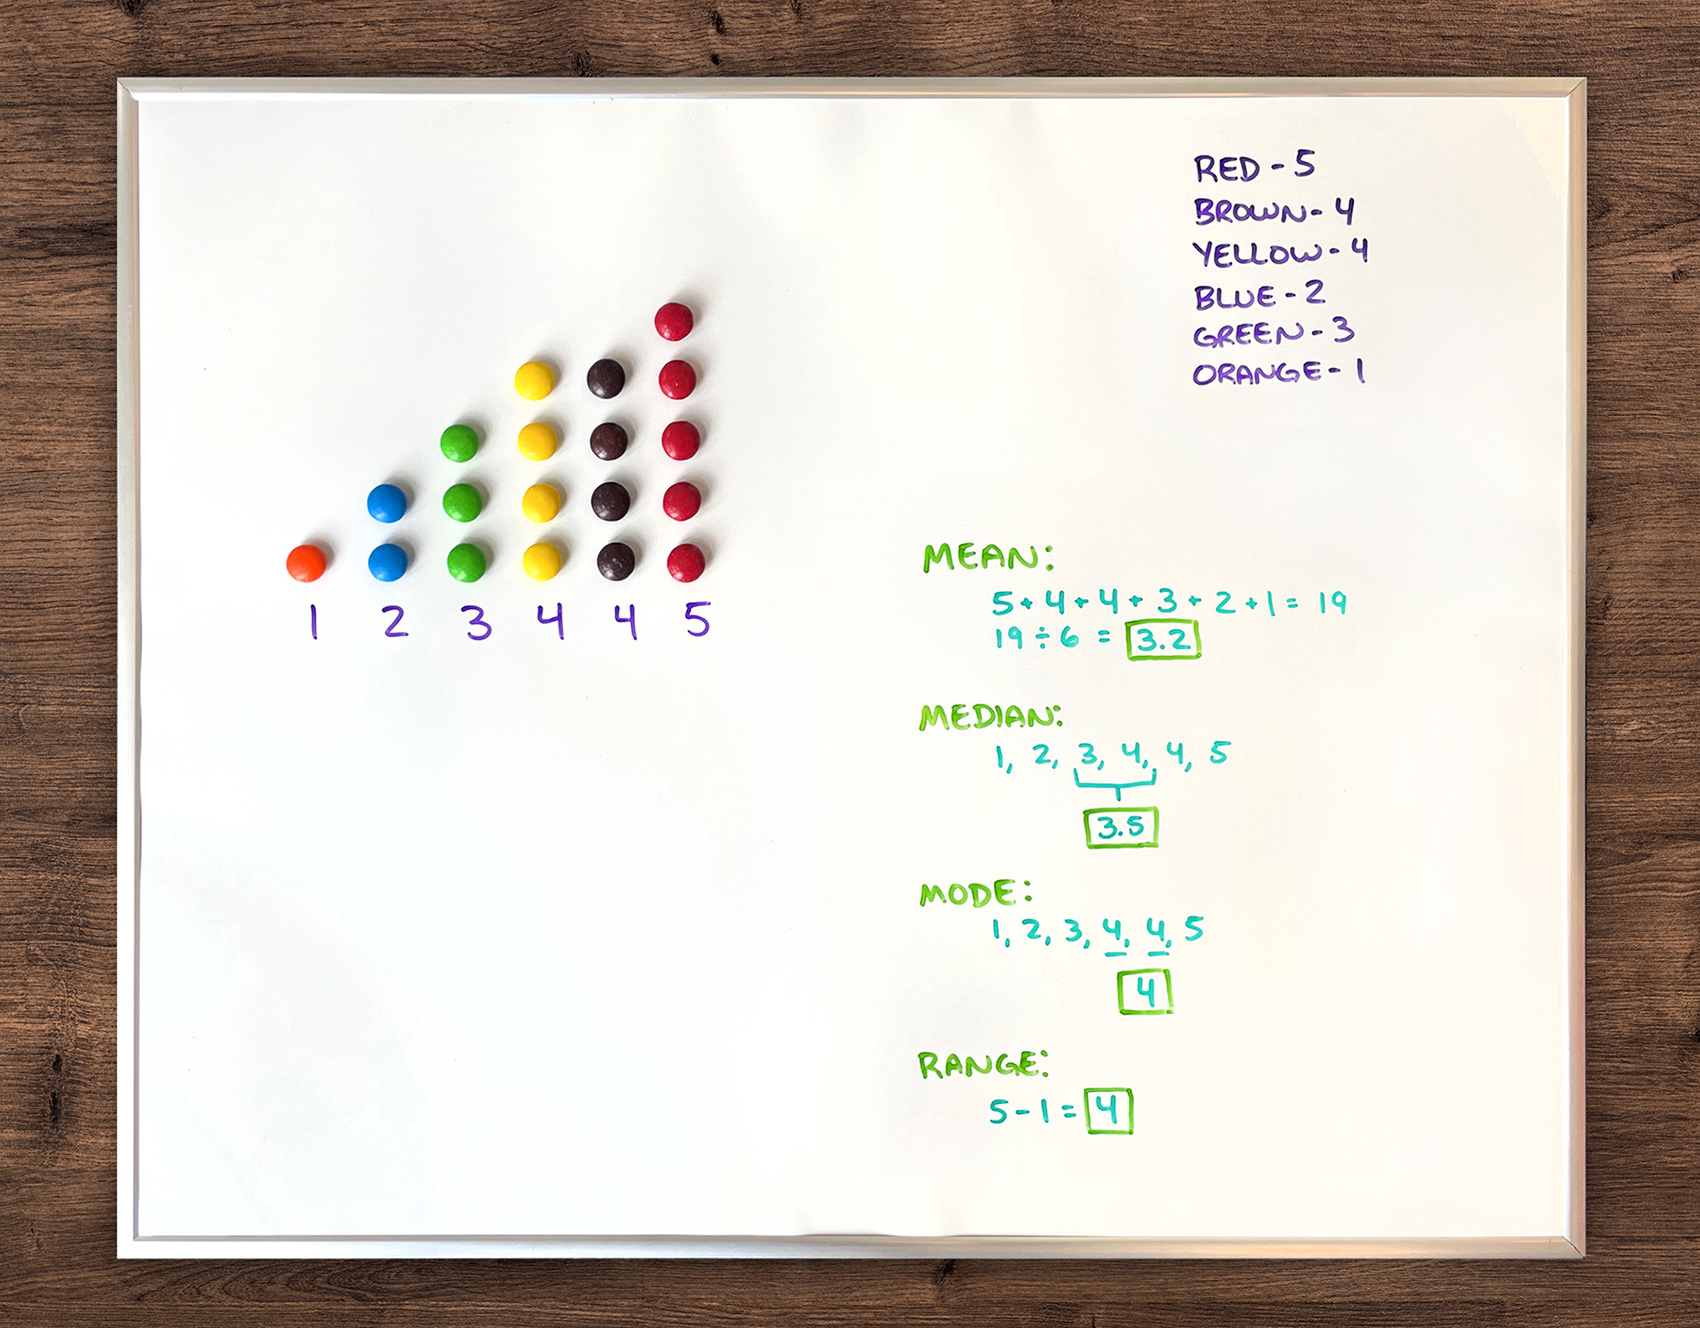
Grab a pack of candy and get ready to sample some sweet data! Skittles, M&M's, or any similar assorted candy pieces would work well for this activity. Of course, a healthier snack option like trail mix or animal crackers would work as well.
Students will work as individuals or in pairs to analyze their candy data sets:
First, students will count how many candy pieces of each color they have.
Example: 5 red, 4 brown, 4 yellow, 2 blue, 3 green, 1 orange
Next, students will find the mean, or average, by adding up the numbers in their data set and dividing the total by the number of candy colors: 5 + 4 + 4 + 2 + 3 + 1 = 19
19/6 = 3.2
Mean = 3.2
Then students will find the median, or the middle number: 1, 2, 3, 4, 4, 5
Median = 3.5
Following, students will find the mode, or the number that occurs the most: 1, 2, 3, 4, 4, 5
Mode = 4
And finally, children will find the range, or the difference between the largest and smallest numbers in the data set: 5 - 1 = 4
Range = 4
Pair this data activity with snack time for a sweet treat!

This activity is a great way to practice finding mean, median, mode, and range together as a whole class.
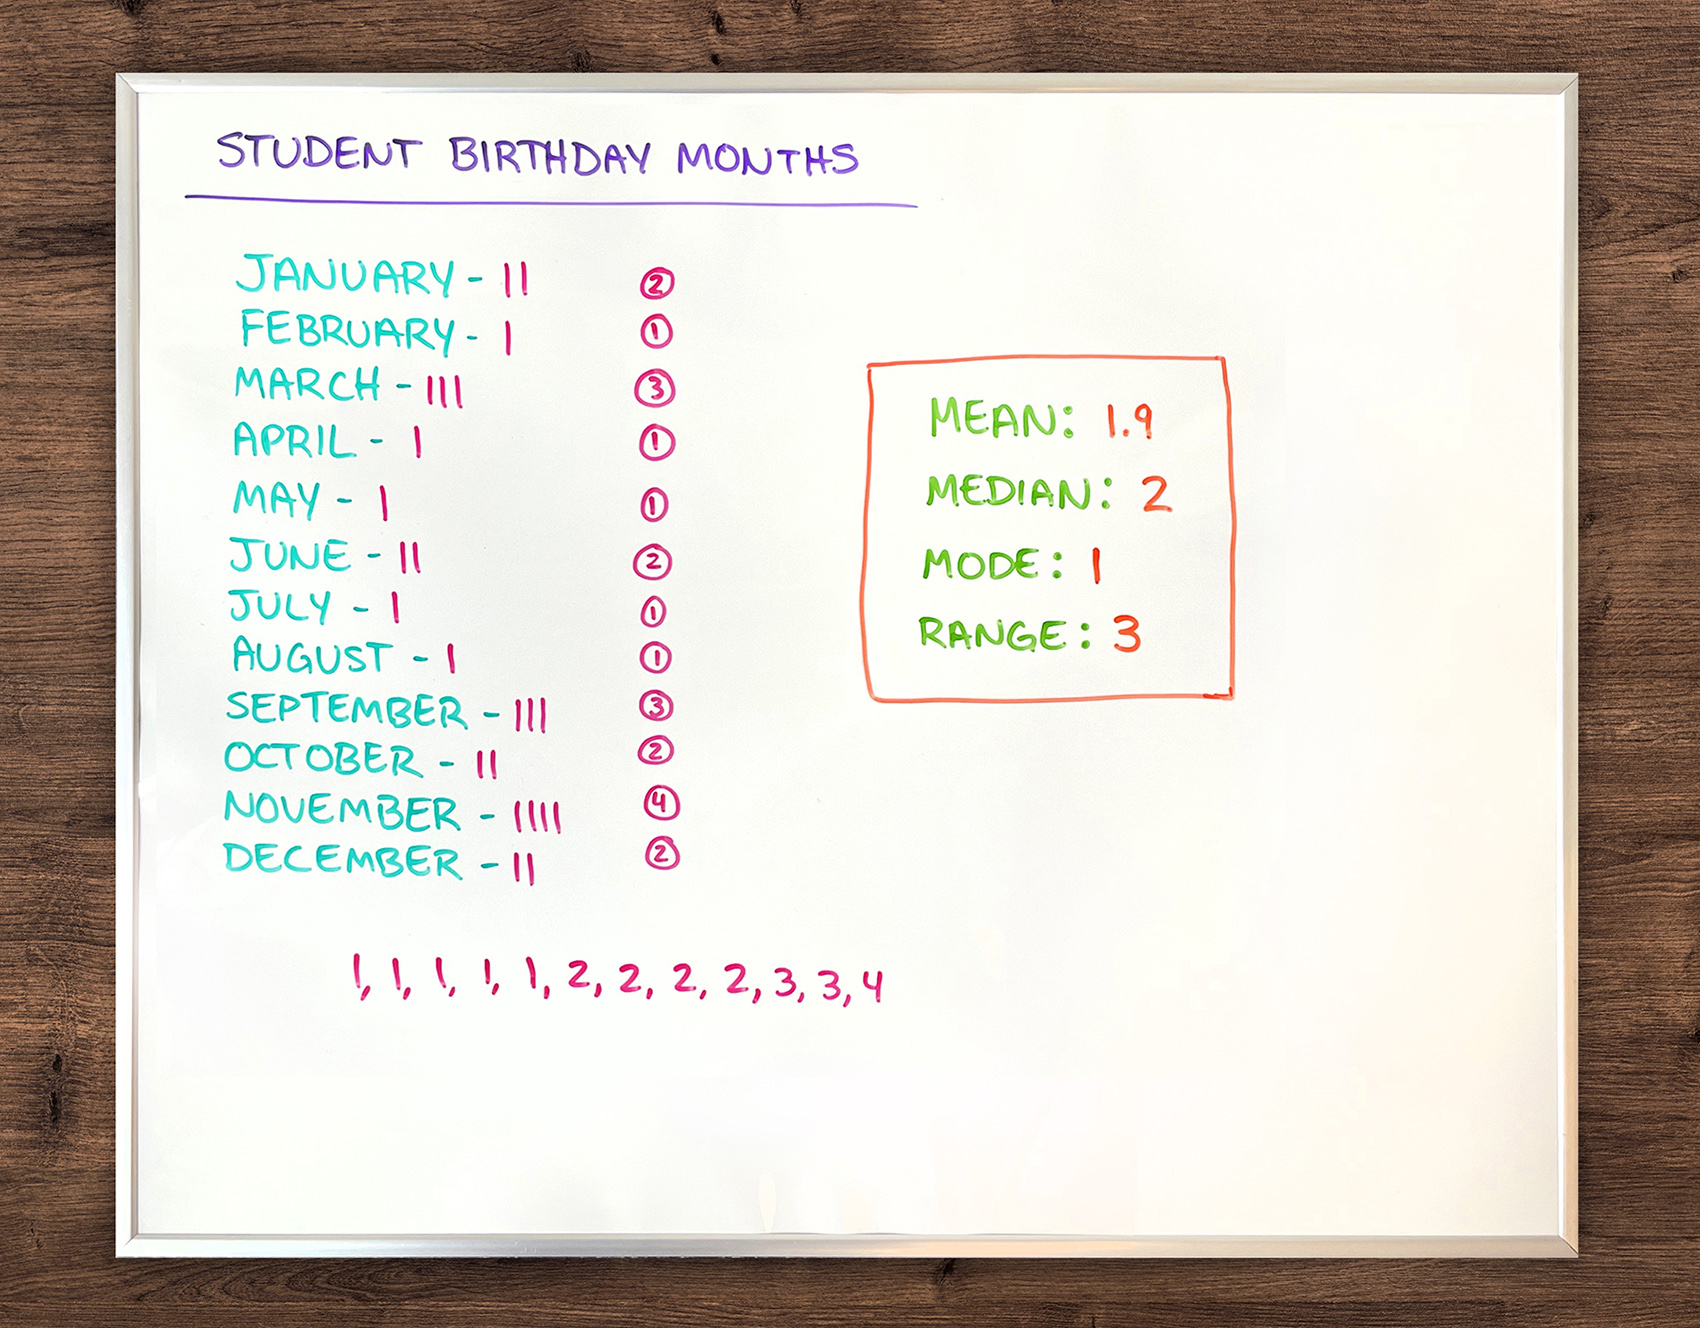
First, decide what kind of data your class will collect. An easy one to do is birthday months. You could also record favorite colors, number of siblings, or any other data your class can think of.
Gather your data together as a class. For example, go around the room and ask every student's birthday month. Record the number of students whose birthday occurs in a particular month on your whiteboard or overhead projector:
January - 2
February - 1
March - 3
April - 1
May - 1
June - 2
July - 1
August - 1
September - 3
October - 2
November - 4
December - 2
Then, work together to find the mean, median, mode, and range of the data.
Mean = 1.9
Median = 2
Mode = 1
Range = 3
Try the activity with a few different sets of data and call on different students to find the mean, median, mode, and range for each.

In this activity, students will work in small groups to produce data sets with dice and find the mean, median, mode, and range of the data sets. Make sure each group of 2 to 4 students has at least one die to use for the activity. You can provide each group with a pair of dice if you wish, but it isn't necessary.
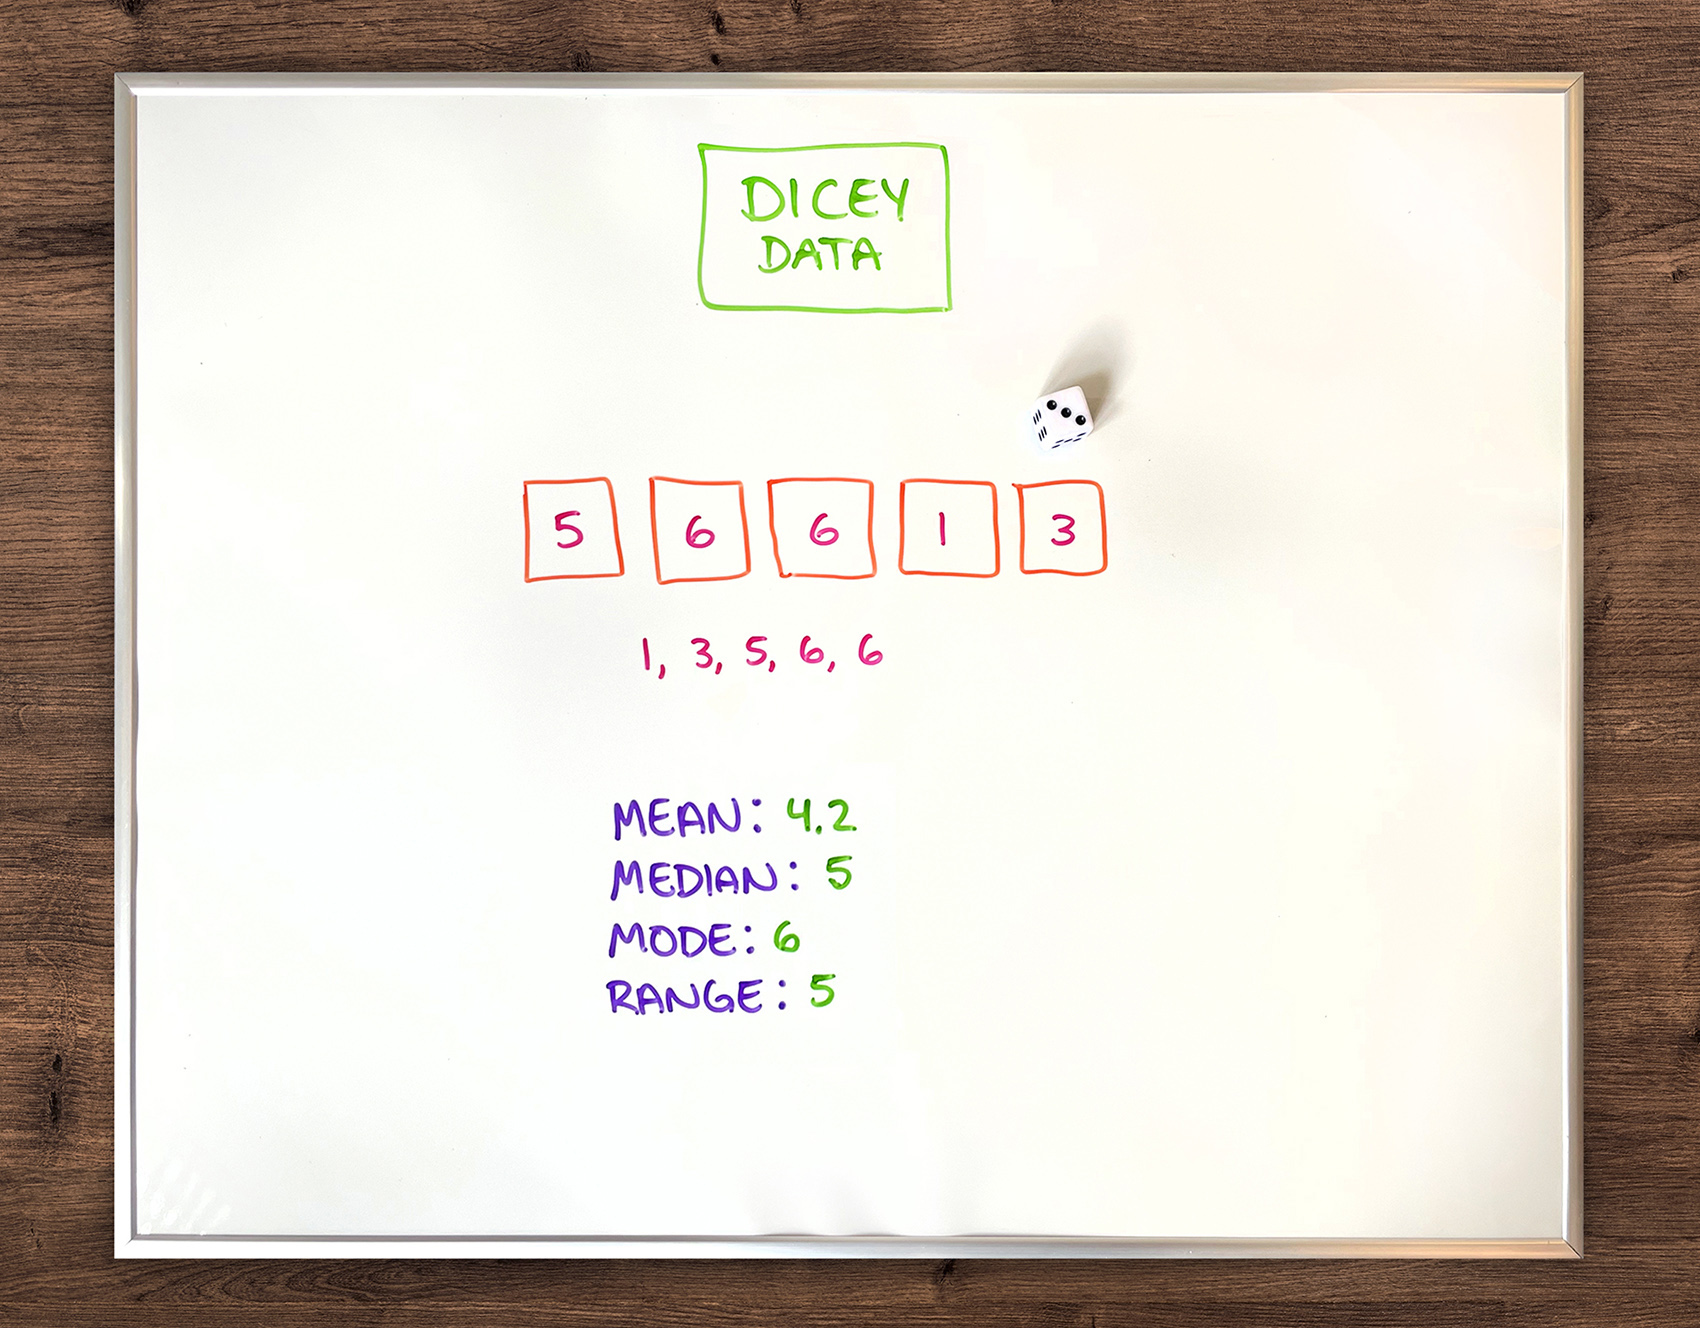
First, students will roll the die (or dice) to come up with the numbers for their data set. For example, have them take turns rolling the die a total of five times to come up with five numbers for their data set. Alternatively, have them roll a pair of dice and add the digits together, recording it as one number for their data set.
Example: Students roll 5, 6, 6, 1, and 3
The group finds the mean, median, mode, and range for the data set.
Try the activity several times with different data sets.
We hope you and your students have lots of fun finding mean, median, mode, and range in these easy, educational activities.
Looking for more interactive math games to practice mean, median, mode, and range? Browse our math lessons on iKnowIt.com!