What could be more fun (or tasty) than practicing math skills with Goldfish crackers? Learn about three ways you can use Goldfish crackers with your little learners to practice graphing and data concepts, including picture graphs, bar graphs, and finding the mean, median, mode, and range of a data set. These activities are adaptable to a variety of grade levels, so get some Goldfish crackers and let's dive in!
For the following activities, you'll want to have a few supplies on hand before you begin. We recommend using Goldfish Colors, or a combination of different varieties of Goldfish (such as pretzel Goldfish, baby Goldfish, etc.) for the data sets. Plan on distributing a handful of crackers to each student on a paper plate. Your students will also need paper, a pencil, and markers to make their picture graph or bar graph. A notebook or blank piece of paper may be helpful for the mean, median, mode, and range activity.
We categorized each of the following activities based on difficulty level: easy, intermediate, and advanced. You can decide which data and graphing concepts are most relevant to your class's needs.
Remember to tag @iknowit on social media if you and your class try any of the following Goldfish graphing activities!

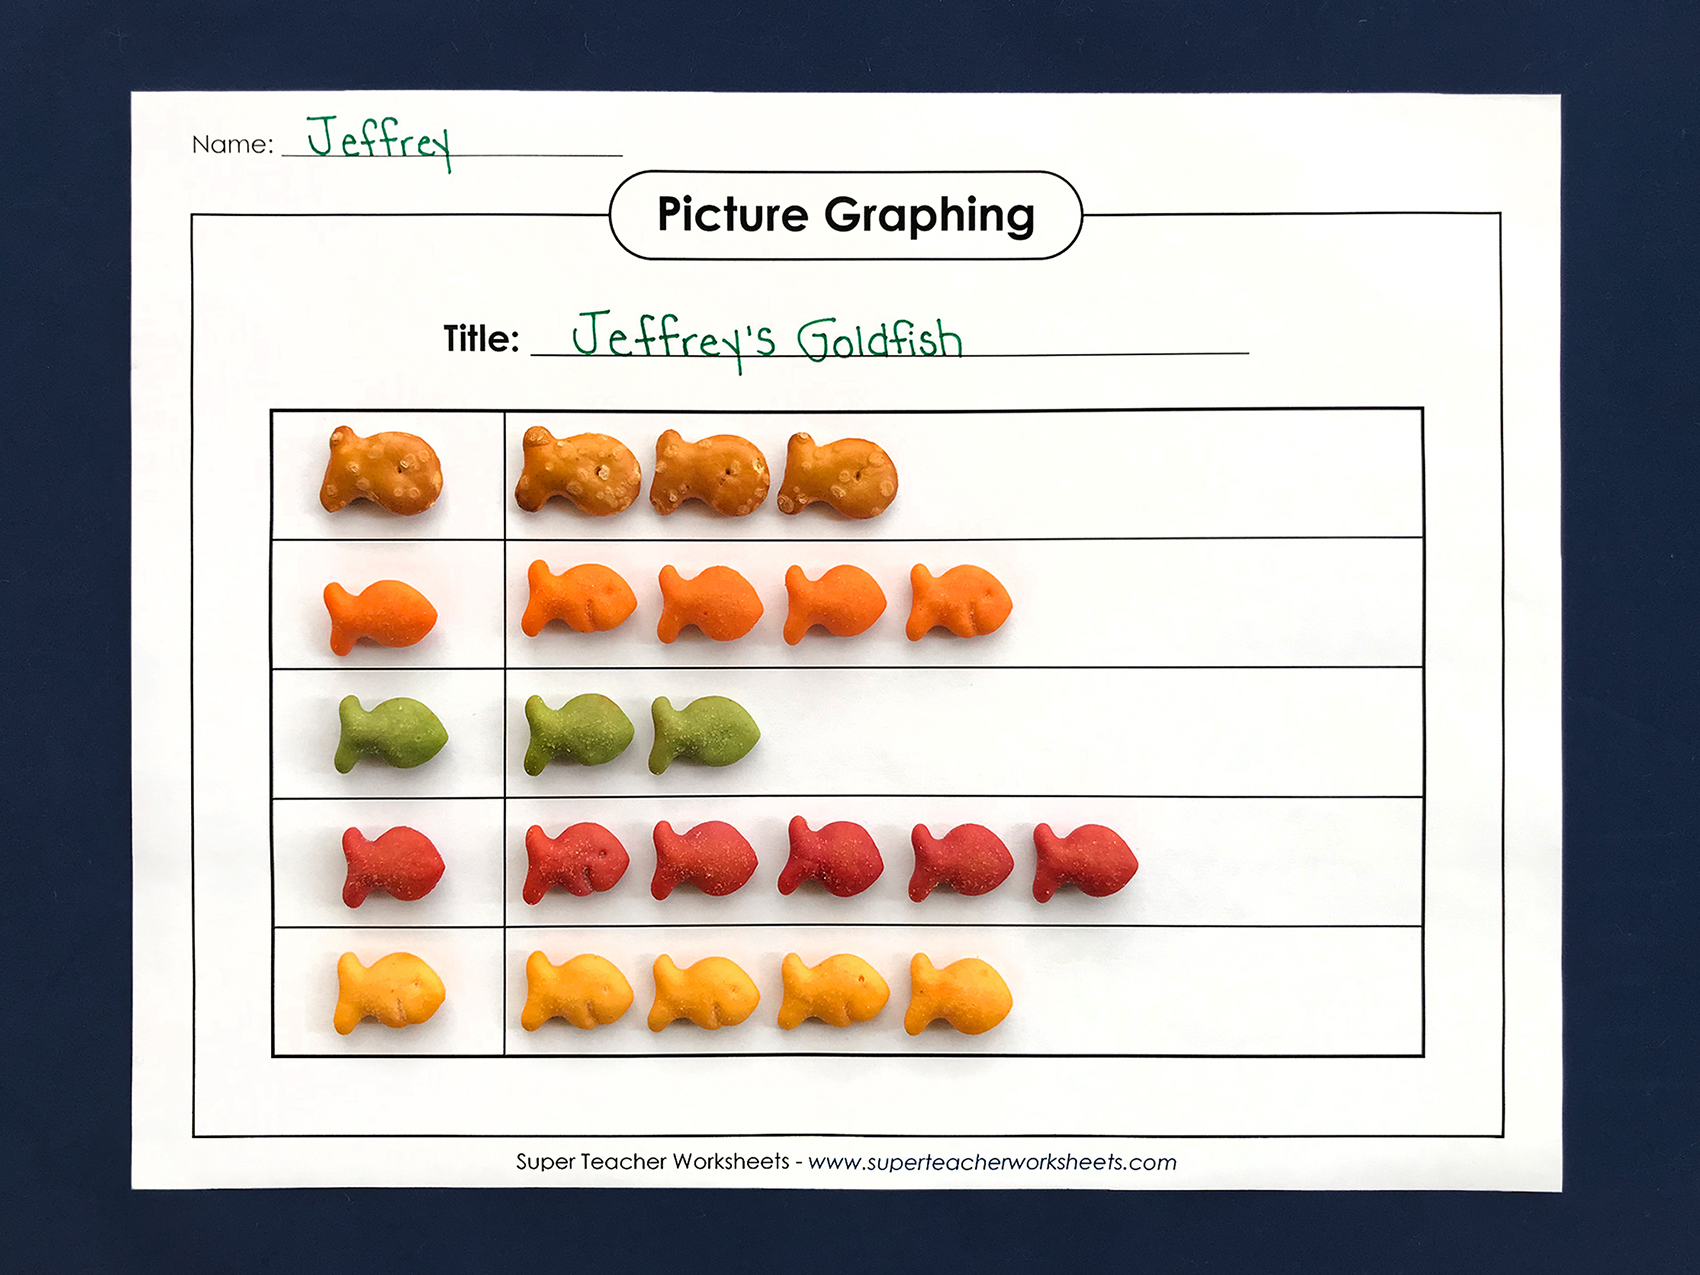
Introduce little ones to basic data and graphing concepts by helping them make a picture graph. Our example uses Goldfish Colors, but you can adapt the activity to whichever variety of Goldfish crackers you choose. (Other snacks, such as animal crackers or alphabet pretzels, also make a great alternative to Goldfish in any of these activities.)
Students will sort the Goldfish crackers on their paper plate by color (or other defining quality). A student may have three pretzel fish, four orange fish, two green fish, five red fish, and four "original" fish, for example. Students will make a picture graph to display their Goldfish "data set." They can either draw their graph on a blank piece of paper or use this printable picture graph template.
Students may use the Goldfish crackers from their data set to fill in the picture graph or they may draw the correct number of fish for each color directly on the graph.
Be sure your students title their picture graph and display the data accurately. You may choose to conclude the activity by asking questions about each student's picture graph: "How many red Goldfish do you have?"; "Which color category has the least Goldfish?"; etc.

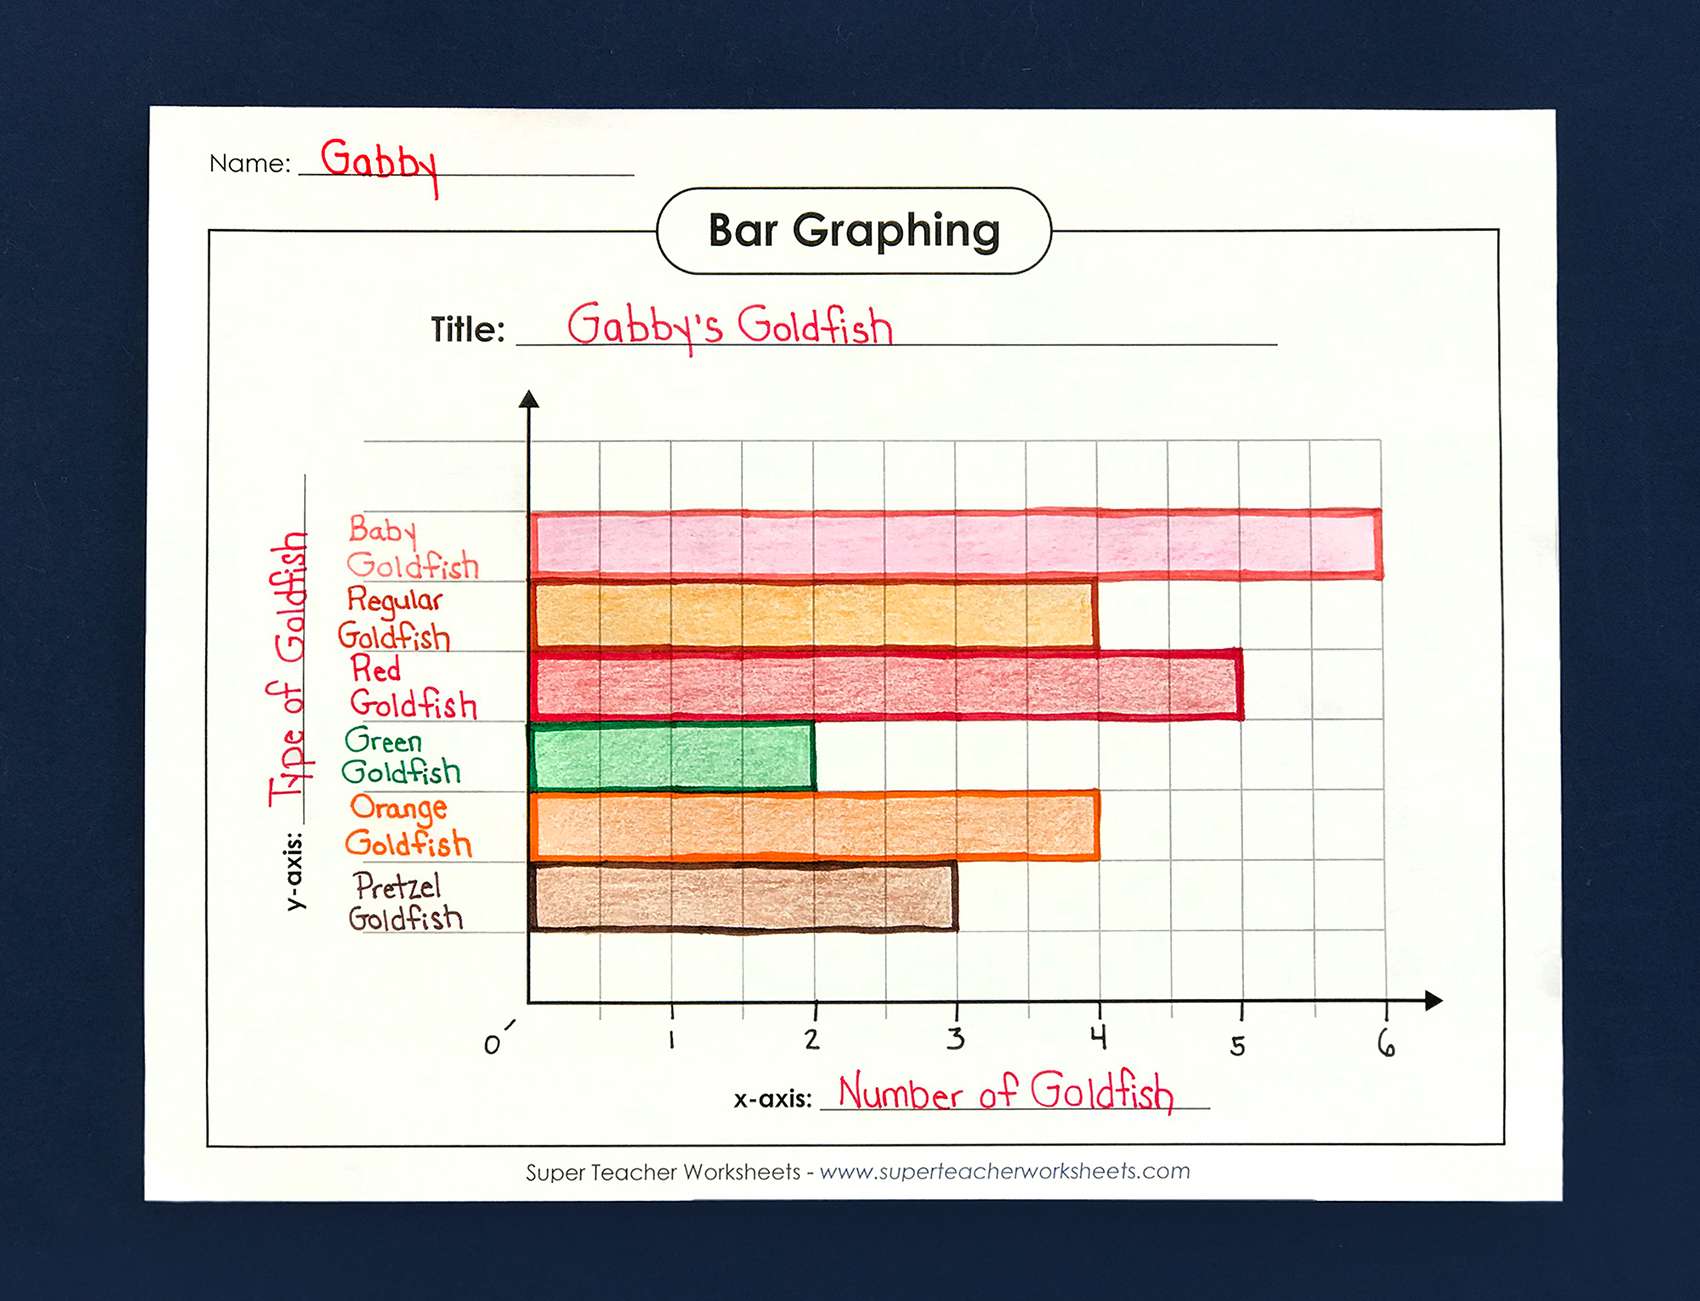
This activity is very similar to the picture graph exercise above. Your students will produce a detailed bar graph from their Goldfish data set. Once students sort their Goldfish crackers by defining quality, they will make a bar graph that includes:
You may choose to have your students construct their bar graph on a blank piece of paper or using this printable bar graph template.
When your students finish making their bar graphs, ask them questions about the data.

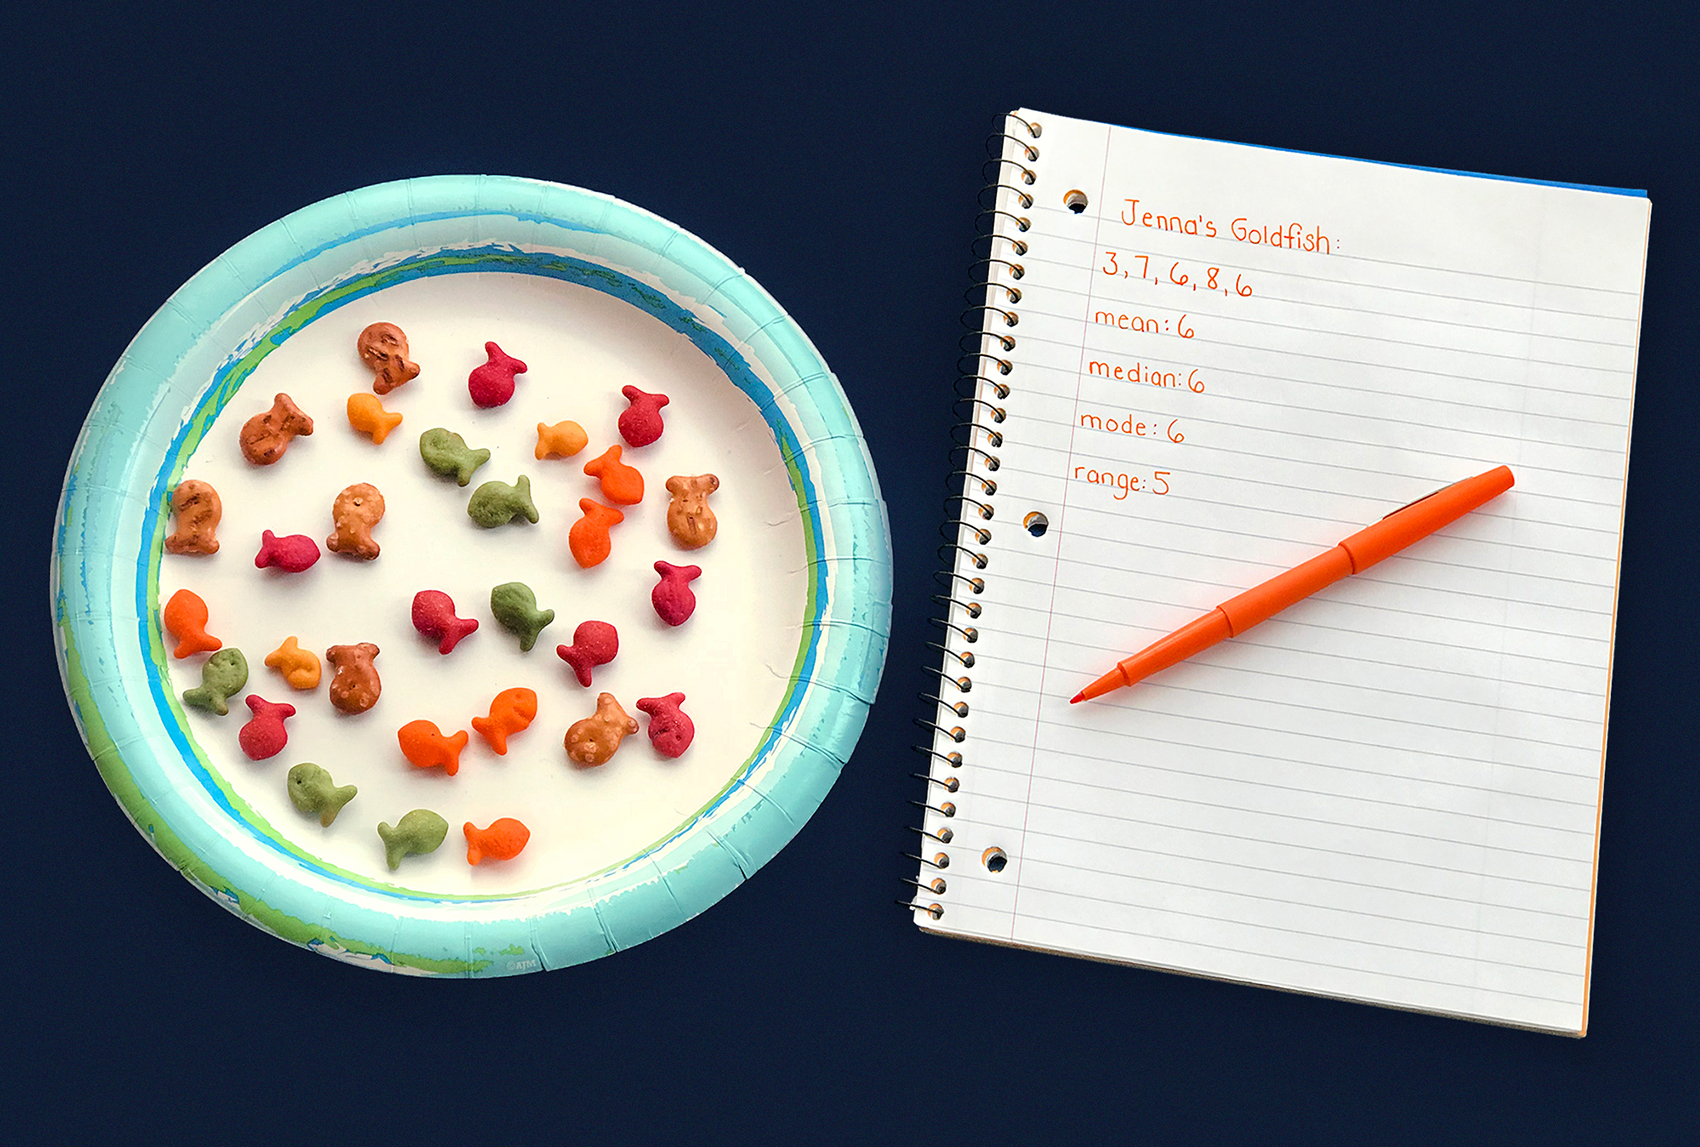
Challenge your students to find the mean, median, mode, and range of a data set using Goldfish. It is ideal to have a larger data set for this activity, so consider using Goldfish Colors in addition to another variety (or two) of the snack crackers. Ideally, your students will be able to sort the crackers into at least four or five groups with defining qualities. Check out our example below:
A student may sort her Goldfish crackers and end up with three baby Goldfish, seven pretzel Goldfish, six green goldfish, eight red Goldfish, and six orange Goldfish. The student will write out the data set in her notebook or on a blank piece of paper:
3, 7, 6, 8, 6
The student will calculate the average of the numbers to find the mean: 6*
Then she will arrange the numbers from least to greatest to find the median: 6
She will note which number appears in the data set most frequently to find the mode: 6
And she will subtract the smallest number from the largest number to find the range: 5
*Be sure to remind students what decimal place you would like them to round to if the mean of their data set is not a whole number.
As these activities illustrate, practicing data and graphing concepts doesn't have to be complicated. It's as easy as grabbing a few boxes of Goldfish crackers!
What did you think of these snack-centered graphing and data activities for kids? Share your feedback in the comment section below. We'd love to hear from you!
If you're looking for more engaging ways to practice graphing and data skills with your students, be sure to browse through our interactive math lessons on iKnowIt.com!