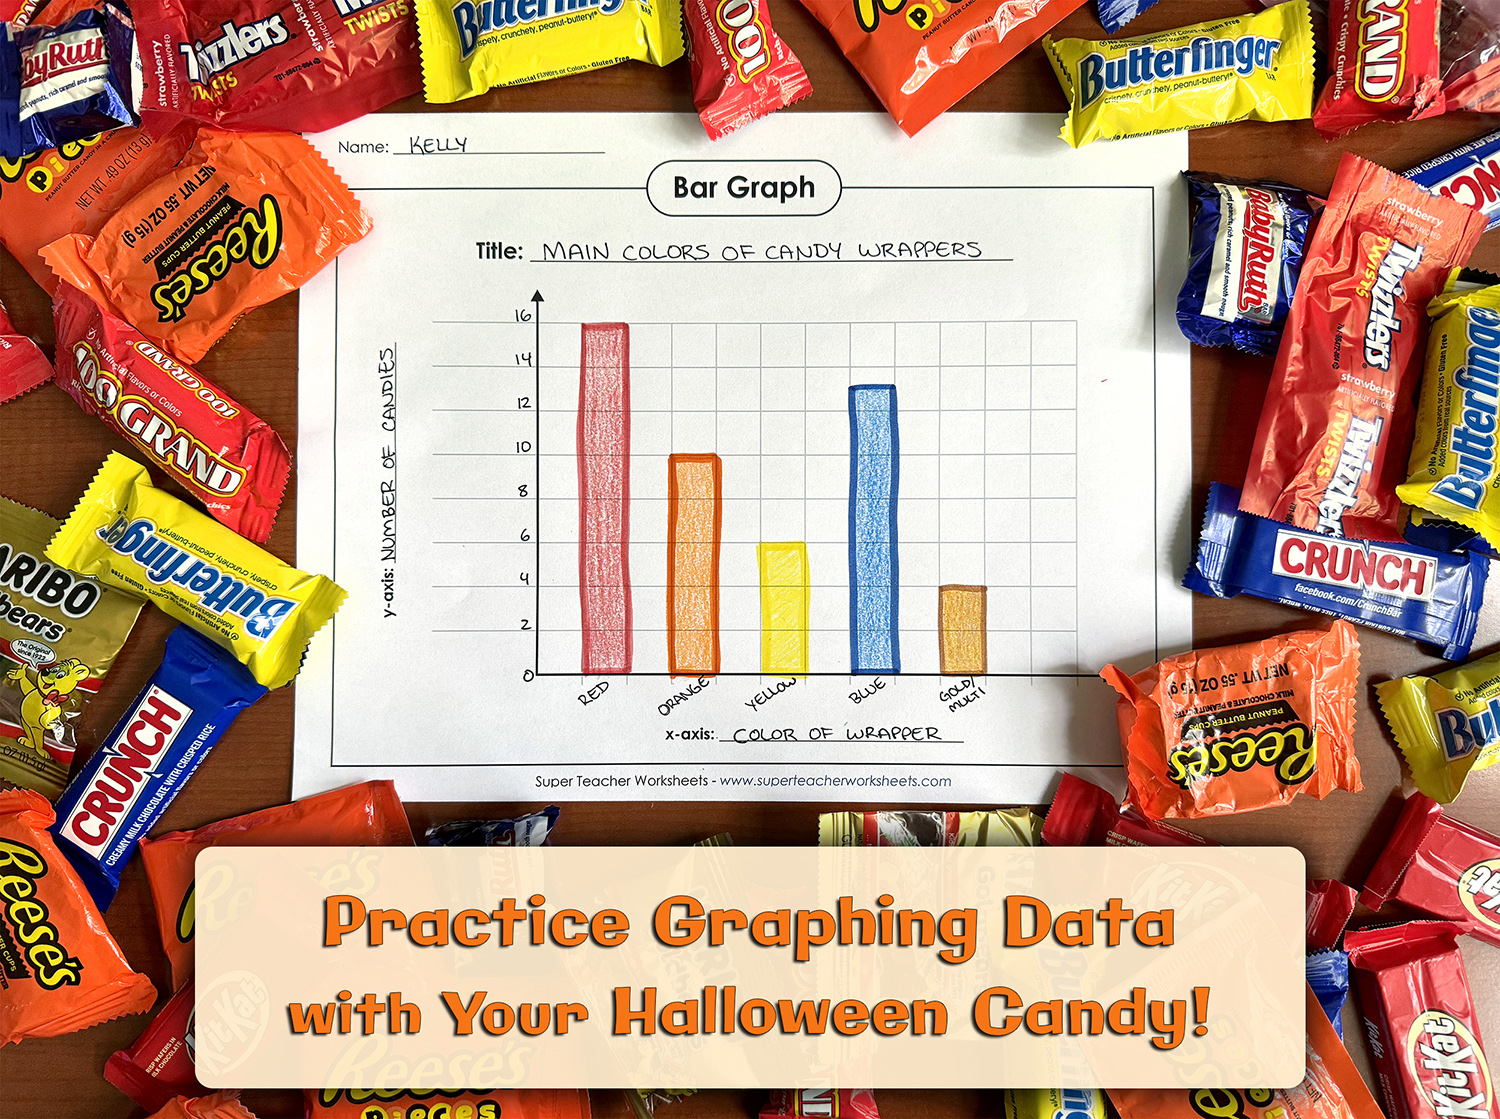
Few times of year are more exciting for a sweet-toothed child (or adult!) than October. Whether you’re trick-or-treating, passing out candy, or simply walking down candy-stuffed store aisles, the Halloween season offers a plethora of hidden sorting opportunities perfect for practicing graphing skills. Let’s dive into a real treat of an activity that’s accessible to all ages!
Materials:
graph paper or a Super Teacher Worksheets bar graph template (vertical and horizontal versions are available)
a variety of candy
pencils (colored pencils, crayons, or markers optional)
scratch paper for data recording (optional)
Step 1: Hunt Down Your Candy
First thing’s first: you and your young ones need some candy to sort! For classrooms, a class party or a well-stocked holiday candy bowl is perfect. For families, shortly after trick-or-treating is an ideal time. Alternatively, if your household hands out one of those variety candy bags, that’s good for sorting too. If none of those are options, get ready for a stroll through a store’s candy aisle—just don’t forget a pen and paper to record your findings!
Step 2: Sort Candy
Time to gather some data by grouping and counting candy.
How creative can your students get when it comes to sorting? In addition to sorting by the candy brand or name, consider: main color of the wrappers (e.g., clear, red, brown, etc.), kind of sweet (e.g. lollipop, chocolate, with or without caramel, etc.), candy texture (chewy, crunchy, melt-in-your-mouth, etc.), number of syllables in the candy name, odd or even number of letters in the candy name, and so on.
If you plan to make multiple graphs, be sure to record the data for each sort using some scratch paper. A simple table with the different groups and the final tallies for each is fine.
Step 3: Graphing Time!
If you’re using blank graph paper, start by drawing your axes with a connecting horizontal and vertical line. If you’re using a premade template, you can skip straight to labeling. Don’t forget to title your graph based on the kind of sort.
Explain to children how important graph labeling is. The x-axis (horizontal) is the independent variable, so it will change depending on what was counted: candy name, color, etc. The y-axis (vertical) is the dependent variable, and for this kind of sorting will always be the total count of the various groups.
Depending on the size of your sorting groups, you’ll need to decide the y-axis scale! Should each increment count for 1? 2? 5? Make sure the top-most line is enough to accommodate your largest group.
If you recorded data for multiple sorts, now’s the time to make multiple matching graphs before moving on to the final step. It’s also the time to decorate if desired. You can use colored pencils, crayons, or markers to fill in the different bars. This looks especially nice on a wrapper-color sort!
Step 4: Discuss and Eat
Ask questions about the data. What kind of candy is there the most of? The least? How much more common is one color of candy wrapper than another? About what fraction of the candy is chocolate? What is the total number of individual candies that were sorted? Familiarize your young learners with interpreting and manipulating data on a graph.
Then, now that all the hard work is done, sample some of your tasty data points. Counting and graphing candy is fun, but nothing beats eating it! (If you opted for a candy aisle walk, consider purchasing a candy of your child’s choice as a post-activity treat.)
—-----------------------------------------------
Kids probably didn’t realize math could be so tasty! However, don’t be discouraged if there are dietary or other restrictions. There are plenty of seasonal sorting and graphing opportunities to teach this crucial skill. Consider a neighborhood walk to count houses that do or don’t decorate for Halloween, colors or shapes of fallen leaves, flavors of pies on display at a supermarket—you name it! You can also check out more graphing and math skills worksheets by clicking here.